How we spend our income
14 September 2026
- News
We’re a not-for-profit organisation. That means any money we make is put back into your homes and services.

Running and maintaining homes is becoming more expensive, with rising costs for repairs, safety and day-to-day services. Despite this, we continue to invest in improving the quality of homes and services you receive.
Last year, we invested £31.2m in major upgrades, including improvements to kitchens, bathrooms, windows and roofs. This helps keep homes safe, in good condition and fit for the future.
We fund this through the income we receive from rents, alongside the surplus we generate each year from other activities such as selling homes.
This year, we made a surplus of £1.7m which will be used to continue improving homes and services and to help keep costs sustainable for the future.
Where our money comes from
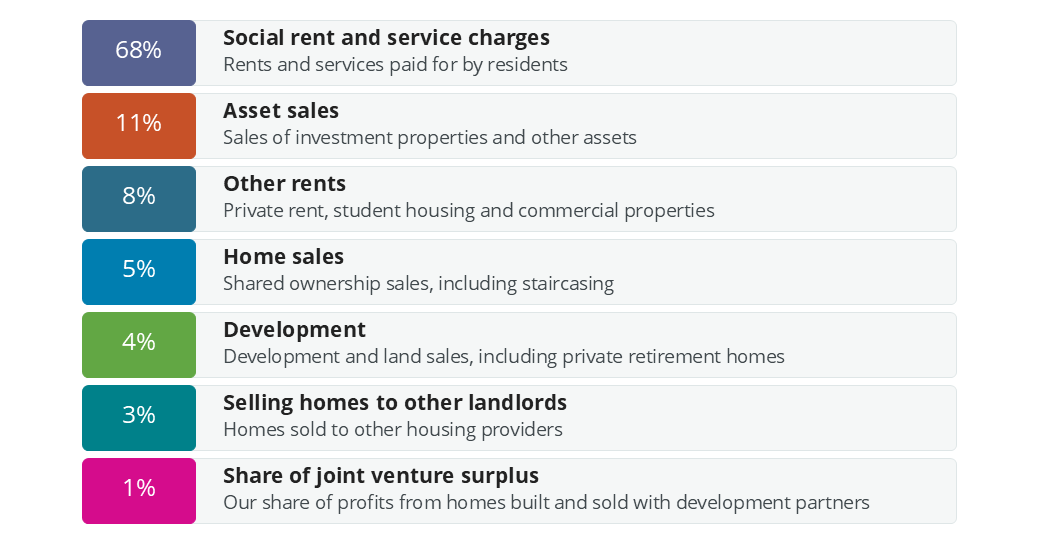
We had a total income of £424m in 2025/26. This came from several sources, with the largest revenue coming from social rent and service charges.
 How we spend every £1
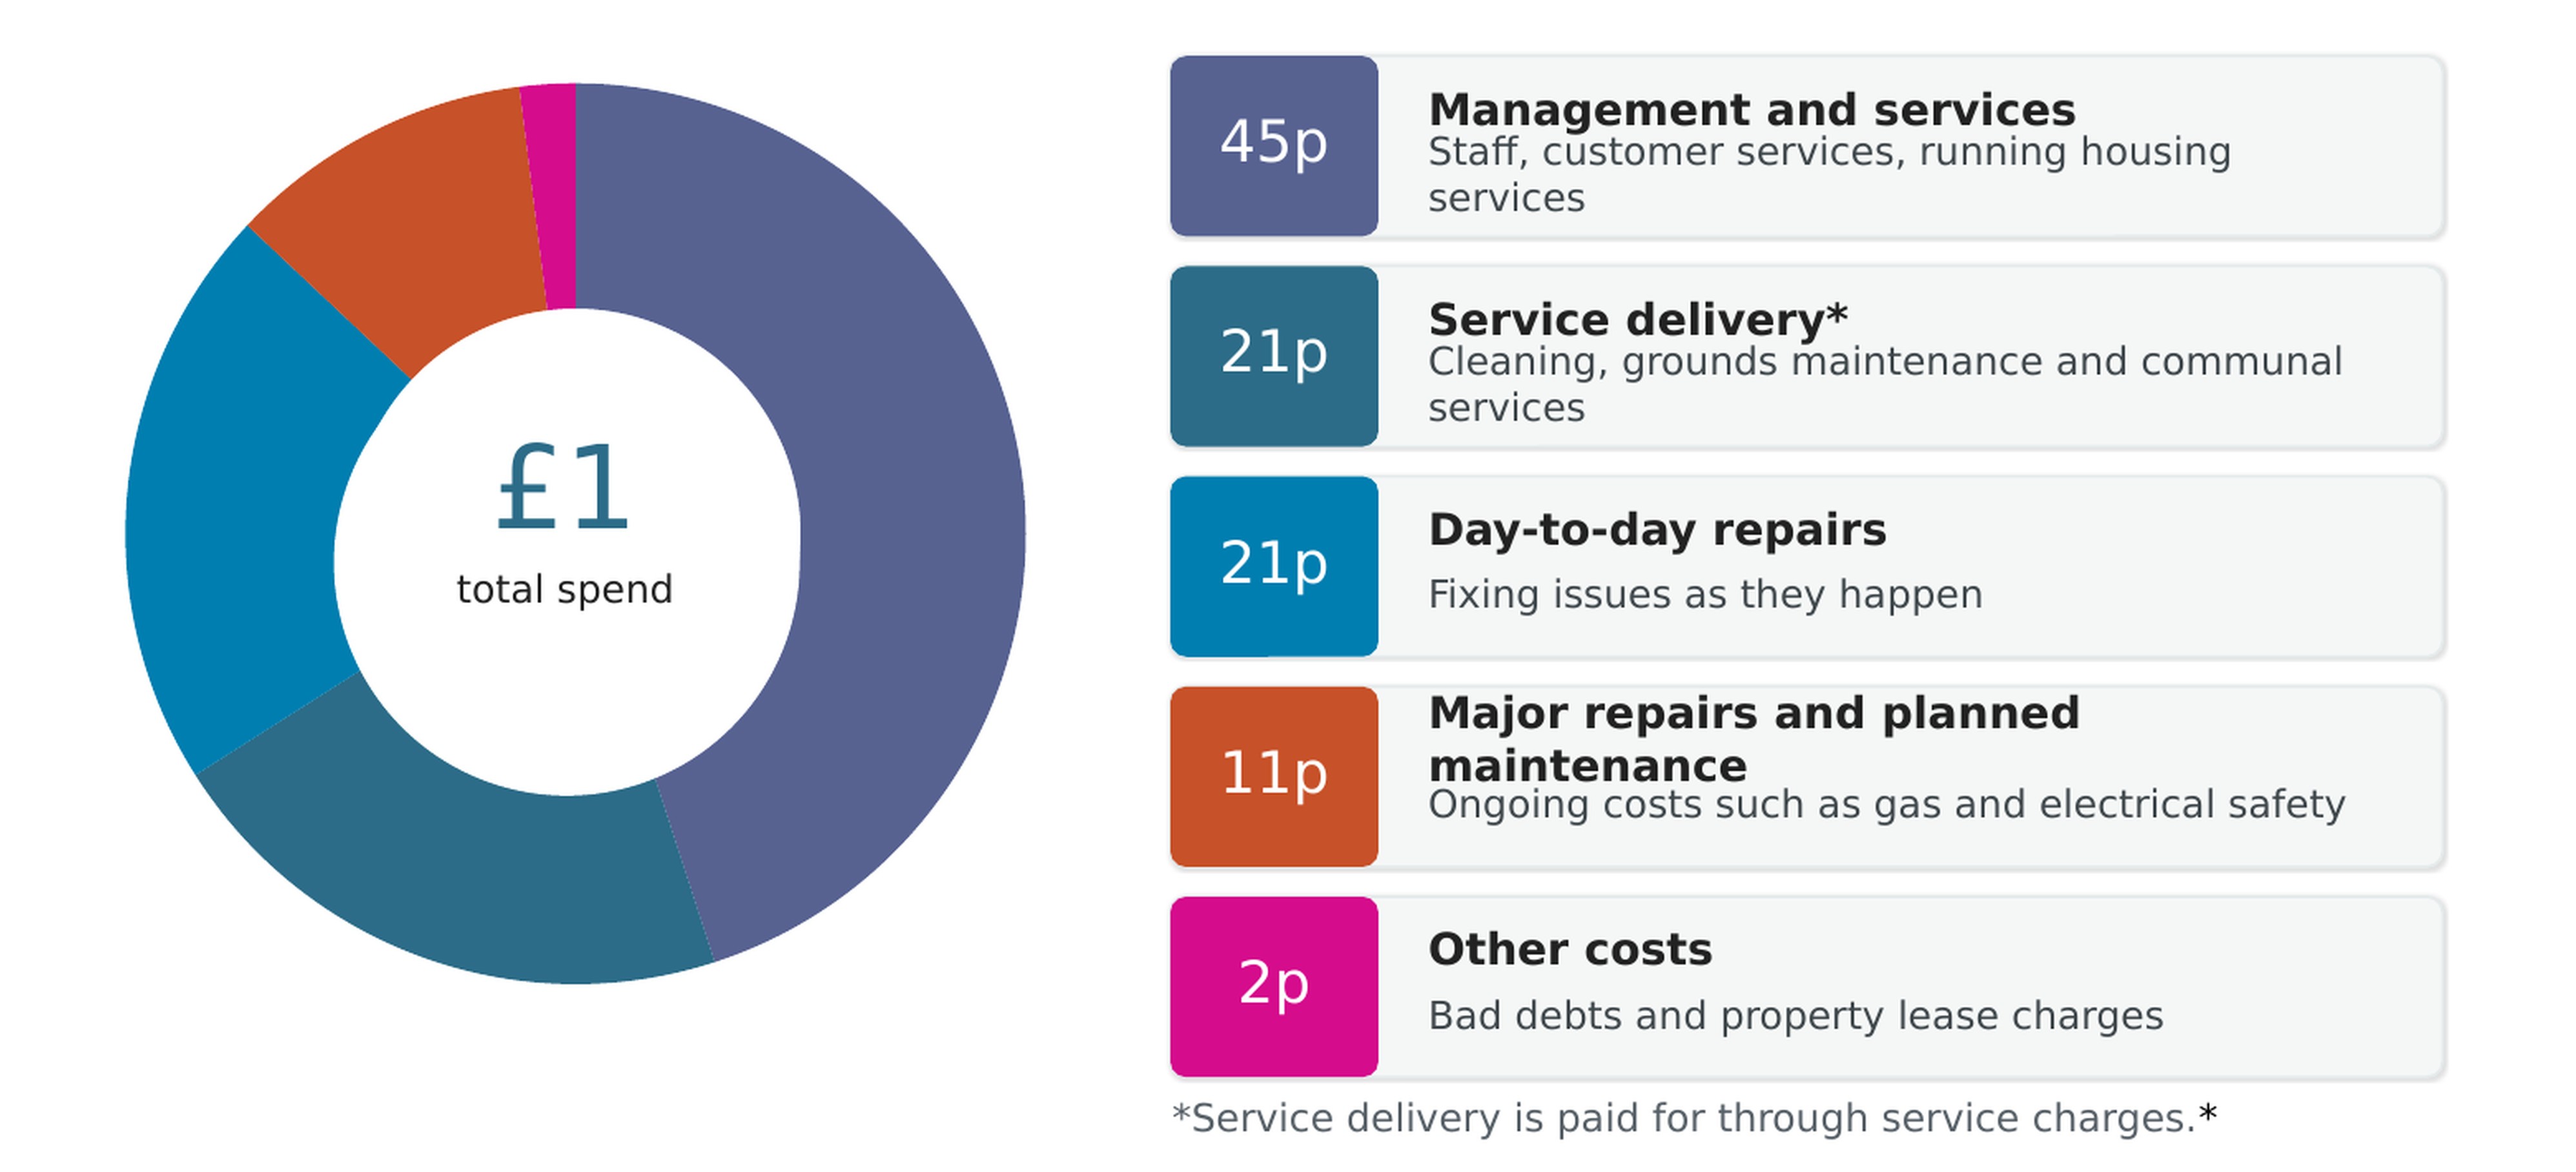
For every £1 we spend on providing services to social housing customers, this is where it goes:
 What it costs to manage and maintain each social rented home
In addition to the £31.2m we spent in capital improvements to homes, on average, we spent £7,507 per home last year to manage and maintain our social rent homes:
Management cost per home - £3,176
Service charge cost per home - £1,269
Maintenance cost per home - £3,062
How we’re delivering value for money
In 2025/26, we delivered £14.85 million of savings through improved procurement and cost efficiencies, helping us invest more in our homes and services. We are continuing to simplify the business, improve processes and invest in technology, with plans to deliver over £30 million of further savings that will be reinvested in customer experience, property safety and maintaining our home.
How much we spend on leadership
We’re required by the Regulator of Social Housing to show how much we spend on senior leadership, compared to the number of social rent homes we manage.
When spread across the social rent homes we manage:
Highest paid director: £10 per home per year (2024/25: £10)*
Total director pay: £52 per home per year (2024/25: £54)**
What these figures include:
*Highest paid director: The highest-paid director figure shows the total pay of the highest-paid director (including salary, bonuses and benefits, but excluding pension and National Insurance), divided by the number of social housing homes we own and manage.
** Total director pay: The total director pay figure shows the combined pay of all directors (including salary, bonuses, benefits, pension and National Insurance), divided by the number of social housing homes we own and manage.